Sign in
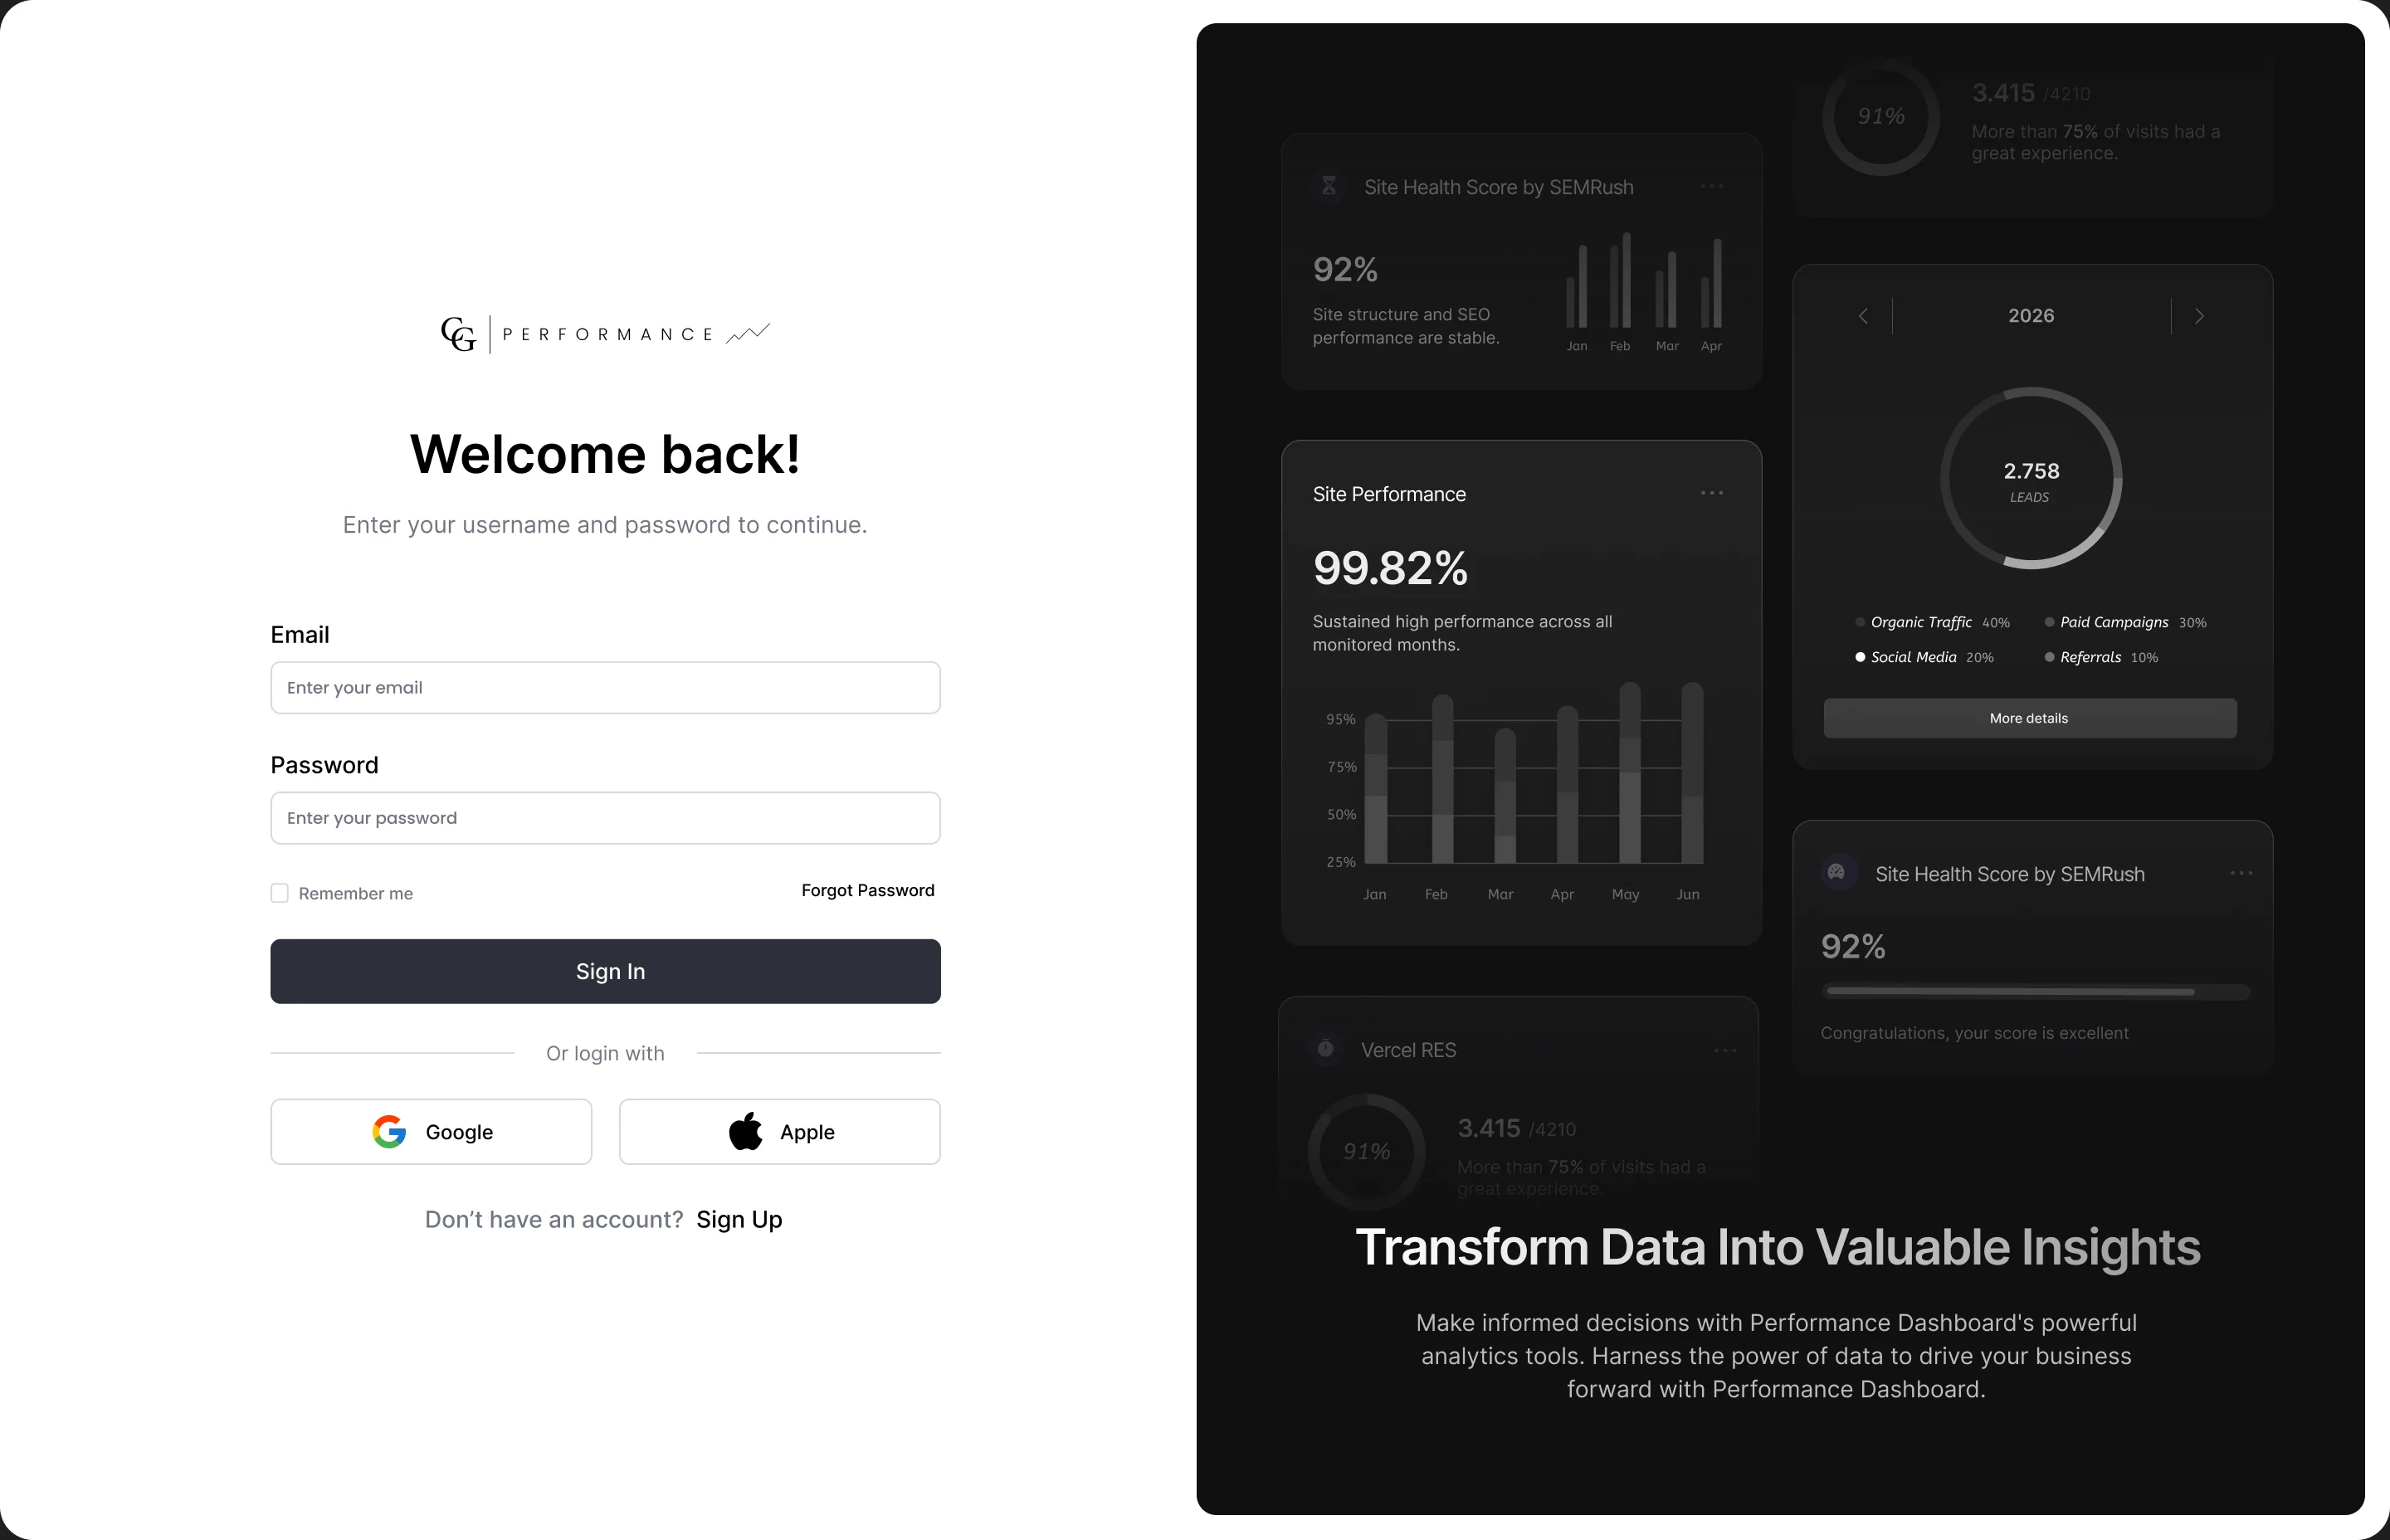
A focused front door
A calm sign-in with email, Google or Apple. The right side previews real dashboard cards, so the first thing a client sees is the value: their data turned into insights.

One place for law firms to see how their website, SEO, calls and leads are performing, in plain language.
The challenge
Law firms invest heavily in their websites and marketing, but the data that shows whether it is working lives in separate tools (hosting, SEO audits, call tracking, form submissions) and is full of technical jargon. Without a single view, it is hard for a firm to know what is working and what needs attention.
The goal
A dashboard any attorney can open and understand in seconds, while still giving The Casely Group’s team the depth they need to manage dozens of firms.
Bring web, SEO, speed, call and lead data into a single dashboard for each firm.
Pair technical scores like RES, LCP and CLS with a clear status and a short explanation.
Use color-coded status and trends so what needs attention stands out without reading every number.
Serve many firms with a client switcher and one consistent, reusable component system.
The navigation mirrors the questions a firm asks: is my website healthy and fast, where are my leads and calls coming from, and what has happened lately. Each module lives in a persistent sidebar, with a firm switcher at the top so the team can move between clients without losing their place.
A snapshot of web, leads and SEO metrics for the selected firm.
Site health and technical performance of the firm’s website.
Real Experience Score and Core Web Vitals, on desktop and mobile.
Incoming calls and where they come from.
Every lead with its source, date and status, searchable and filterable.
Periodic summaries of the firm’s performance.
How the firm’s social channels are performing.
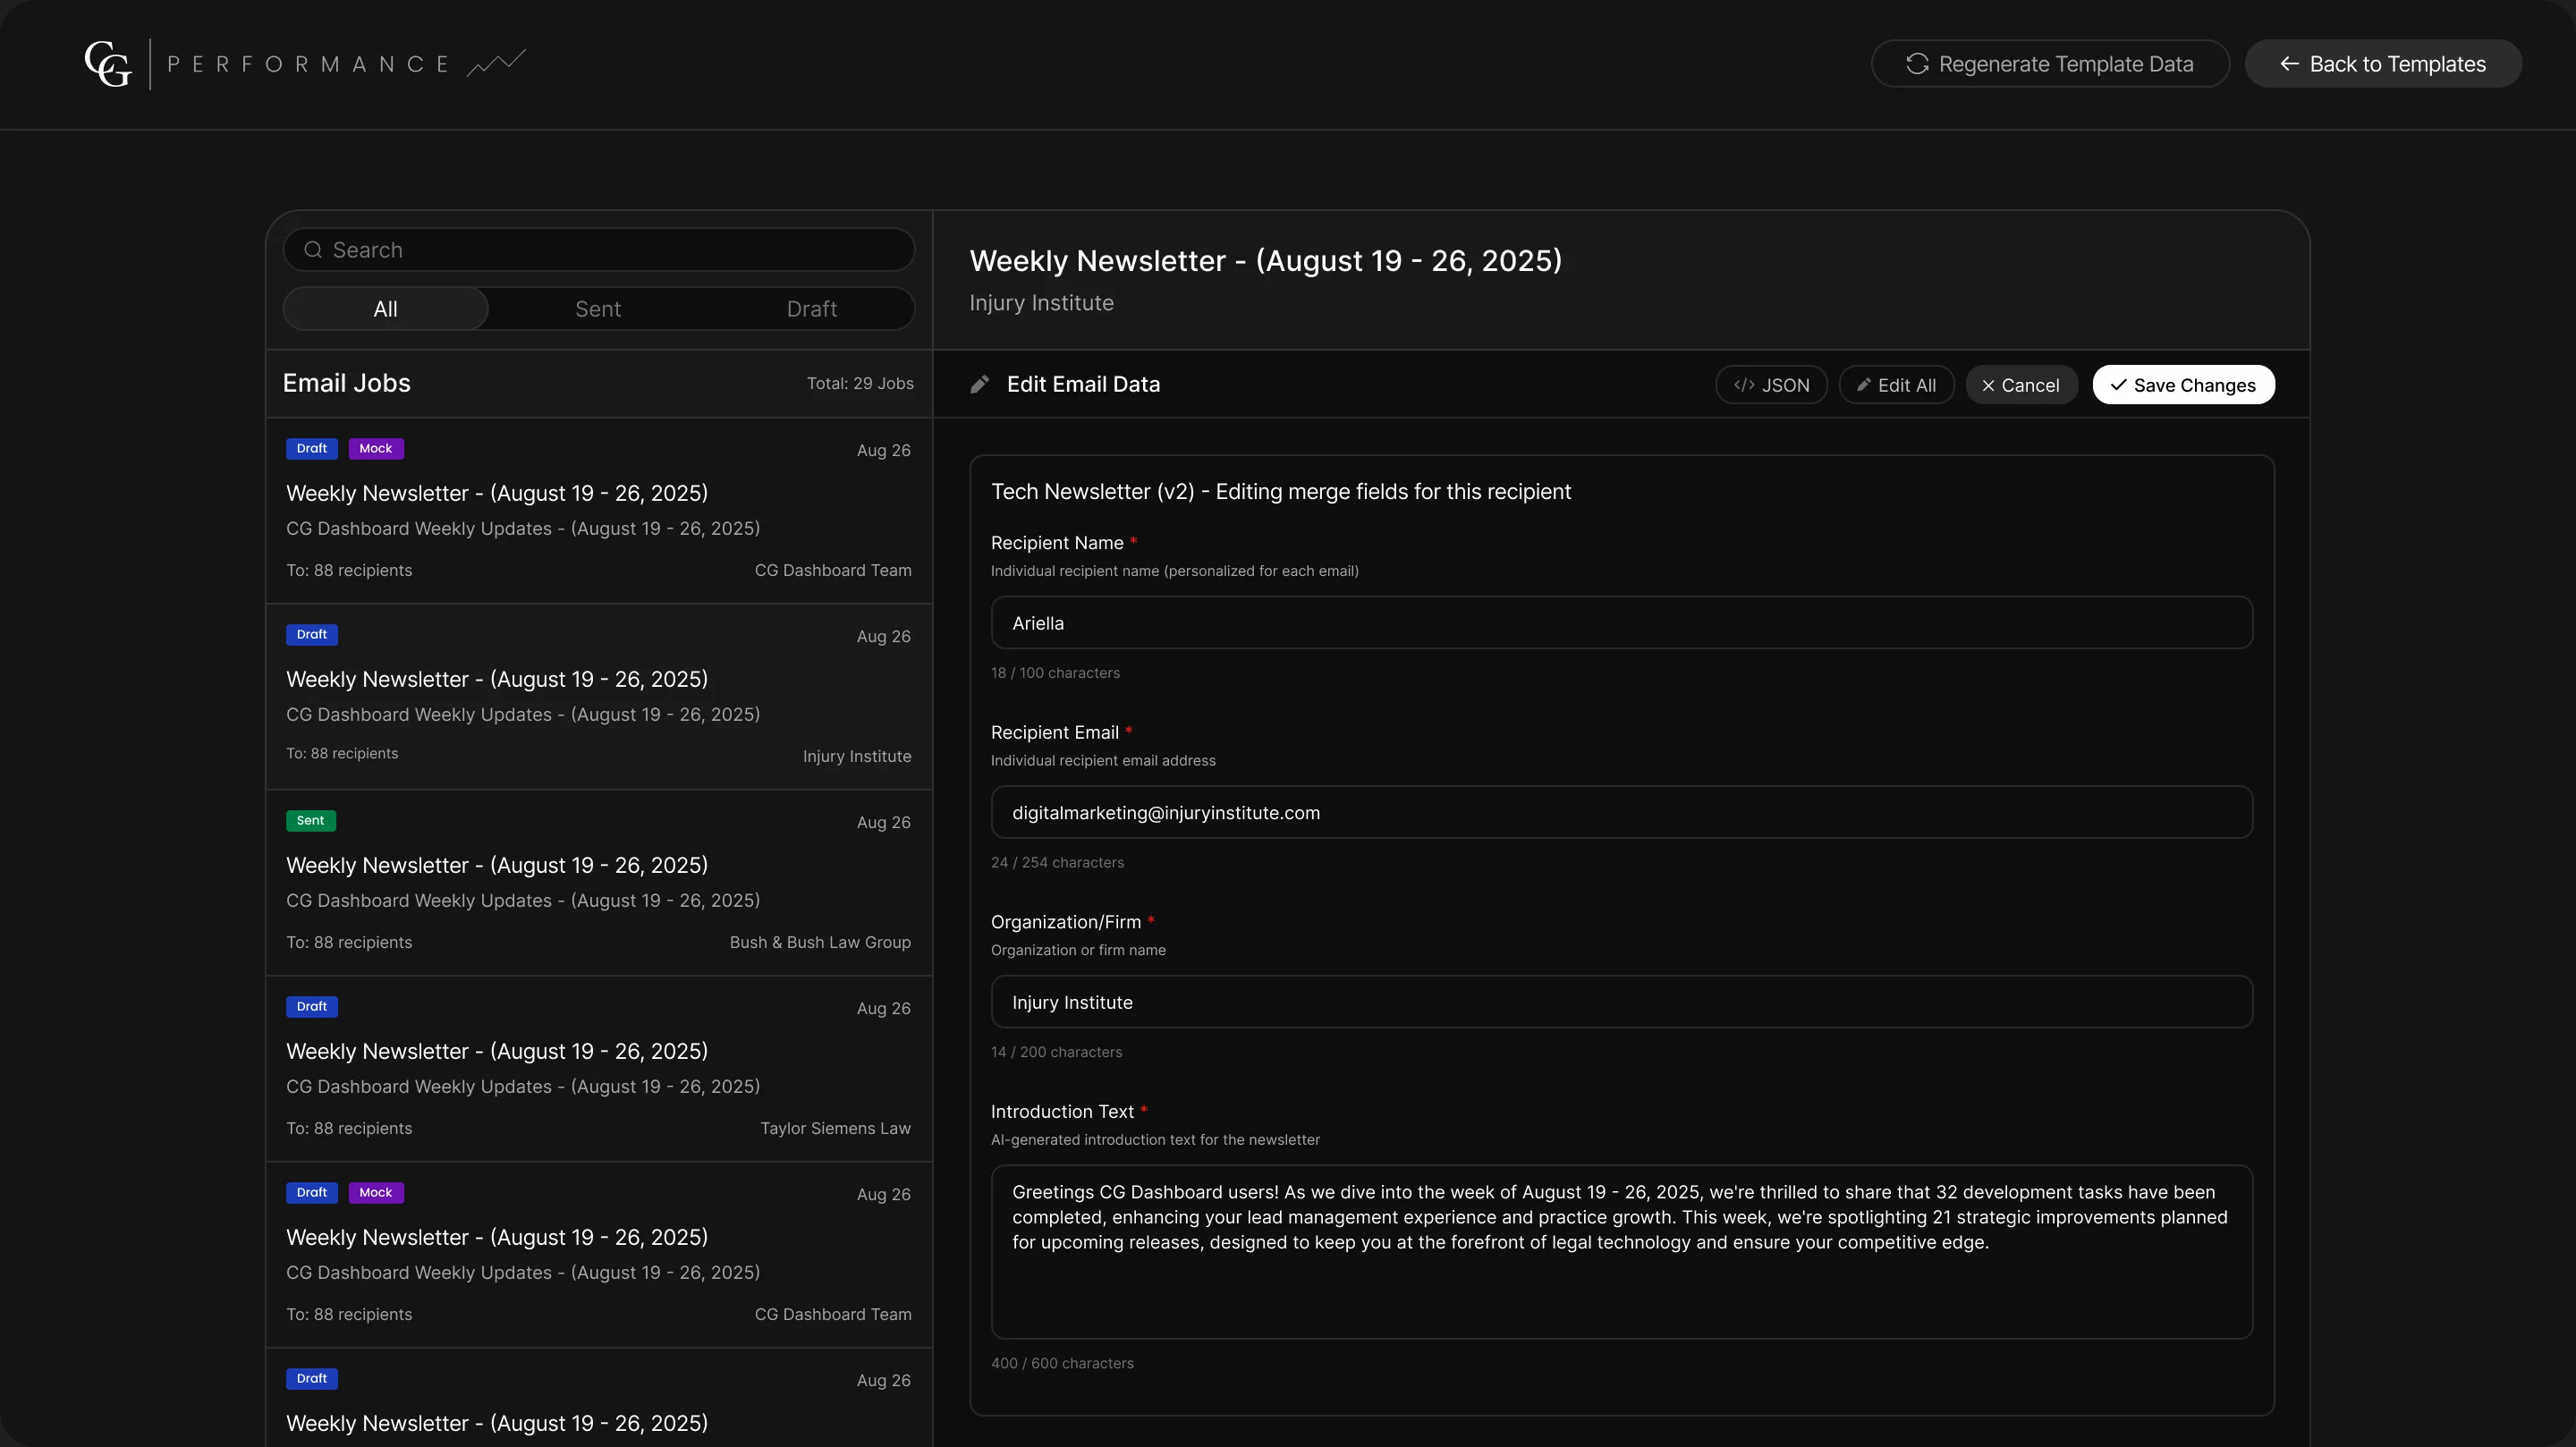
AI-assisted newsletters with per-recipient merge fields.
Sign in
A calm sign-in with email, Google or Apple. The right side previews real dashboard cards, so the first thing a client sees is the value: their data turned into insights.
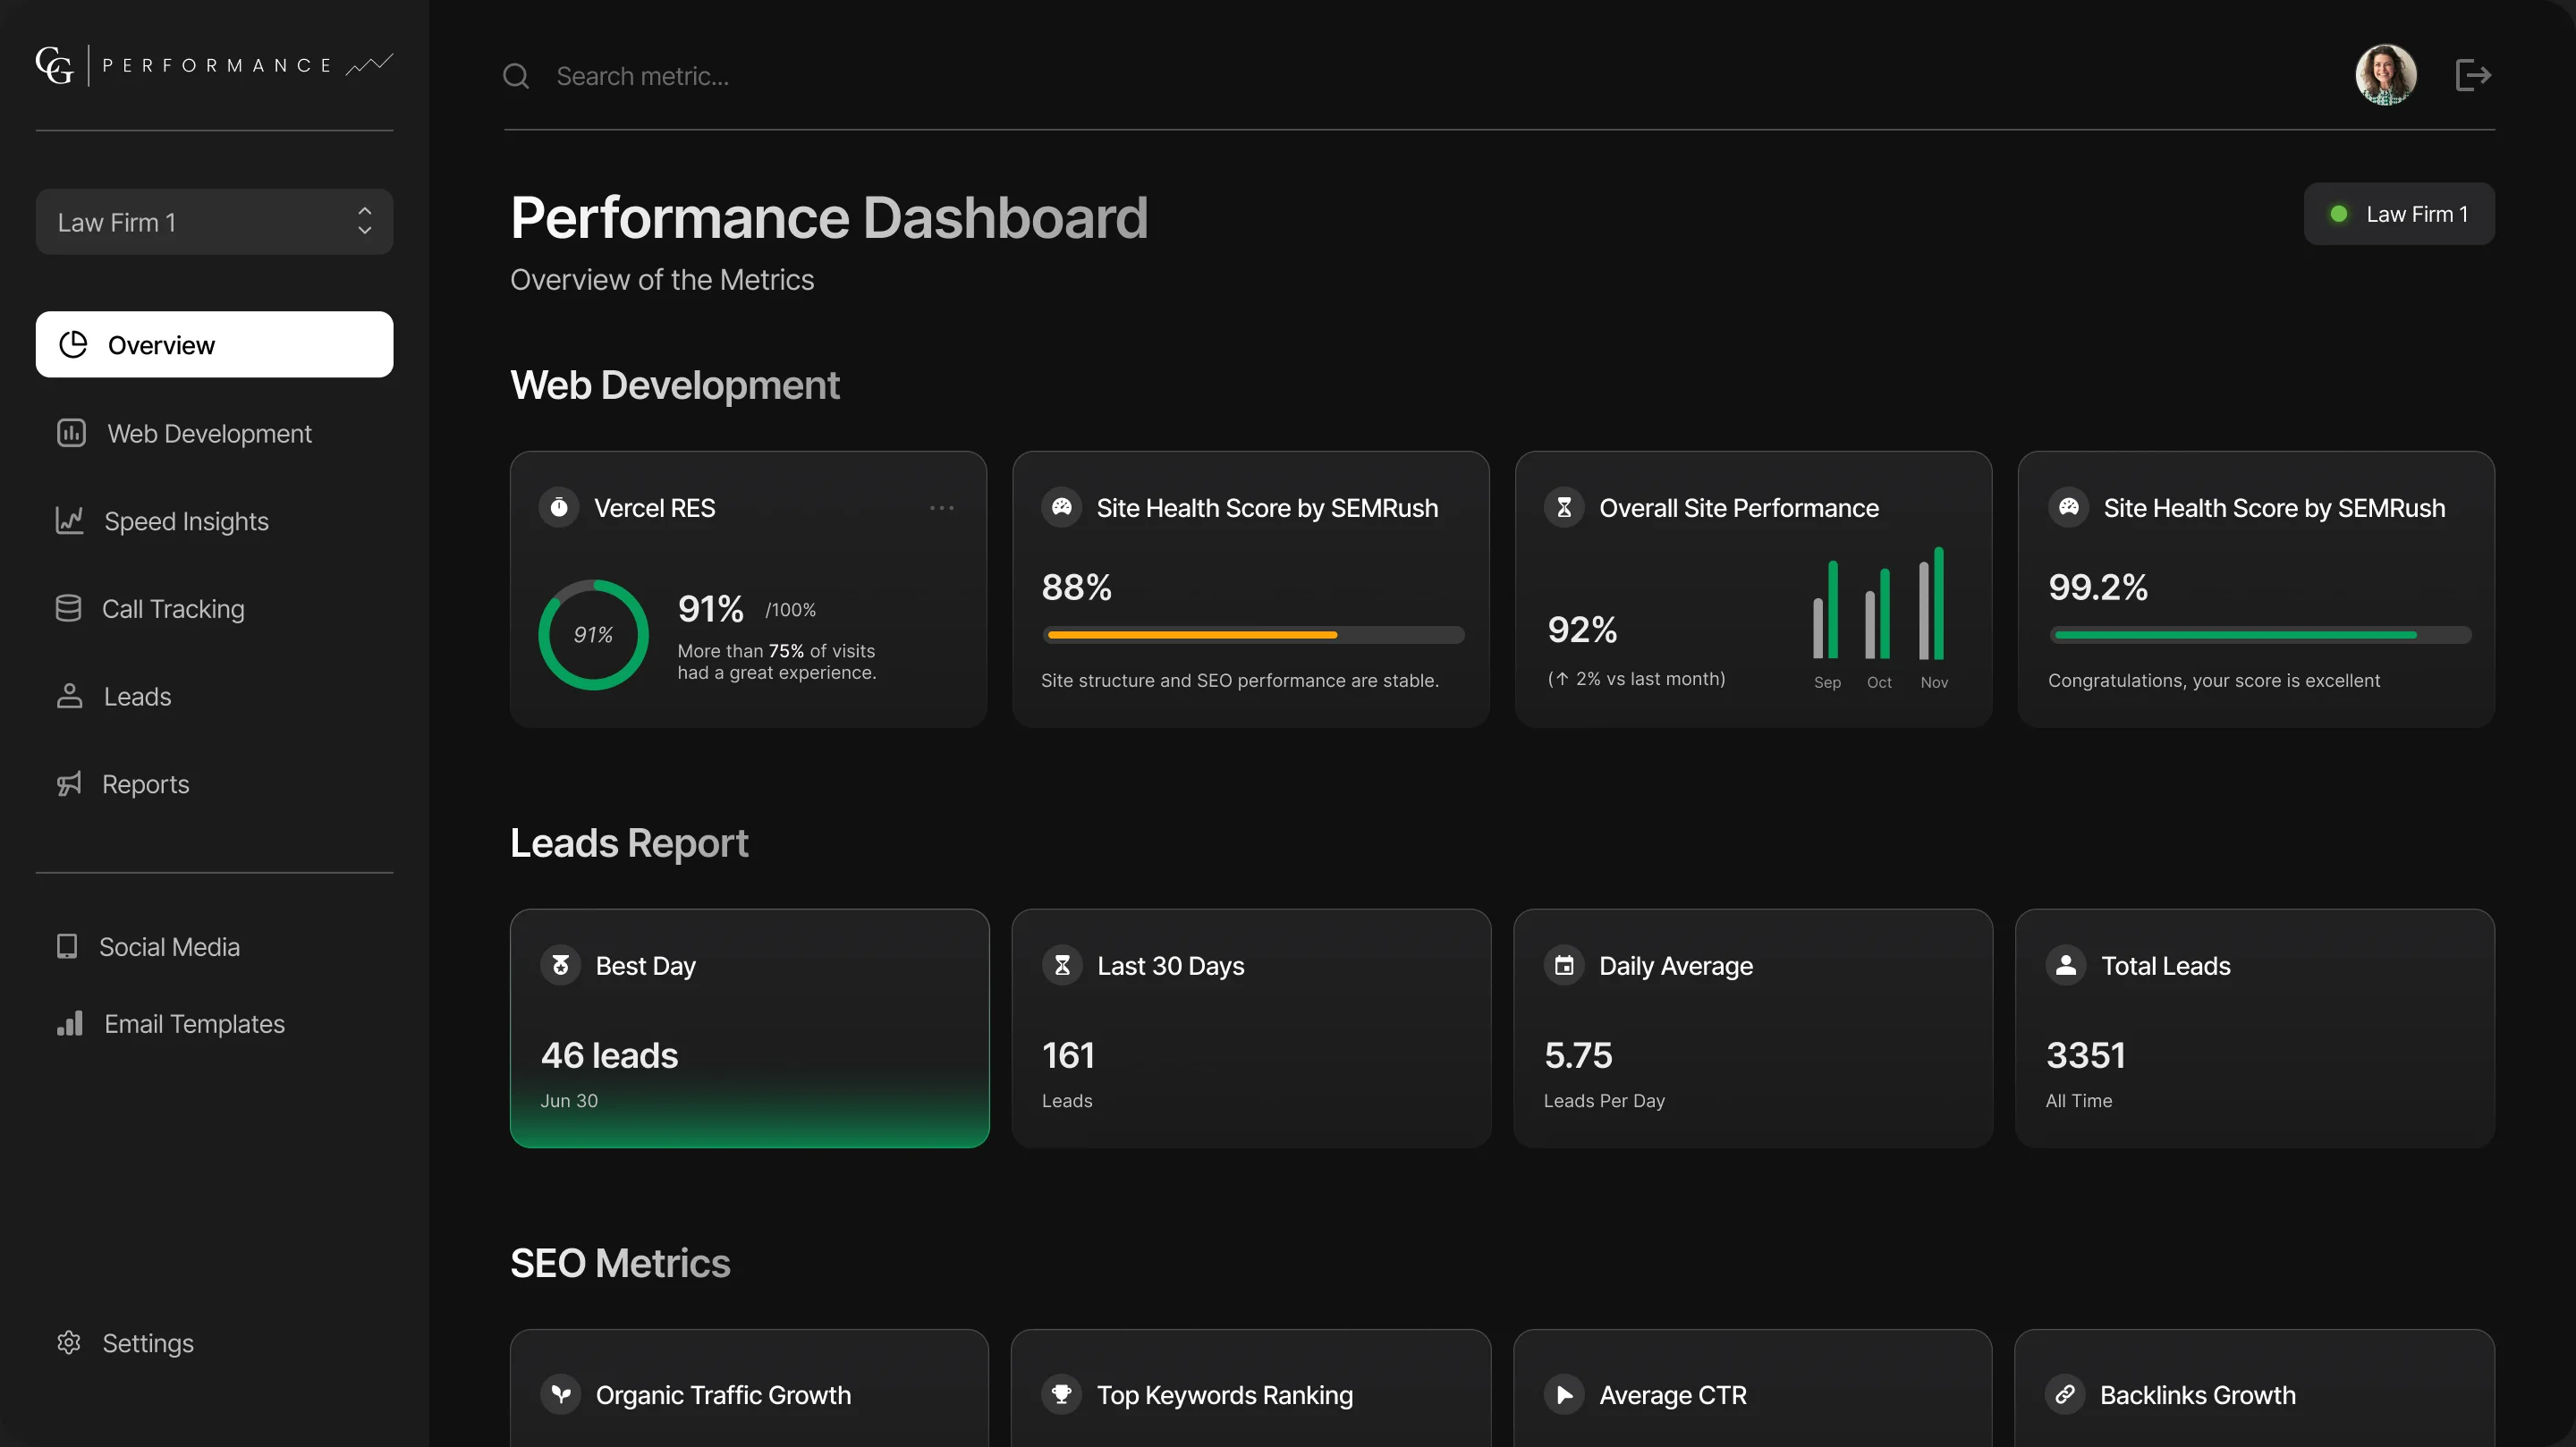
Overview
Metrics are grouped the way a firm thinks about them: Web Development, Leads Report and SEO Metrics. Every card follows the same pattern: one number, its context and a status color.
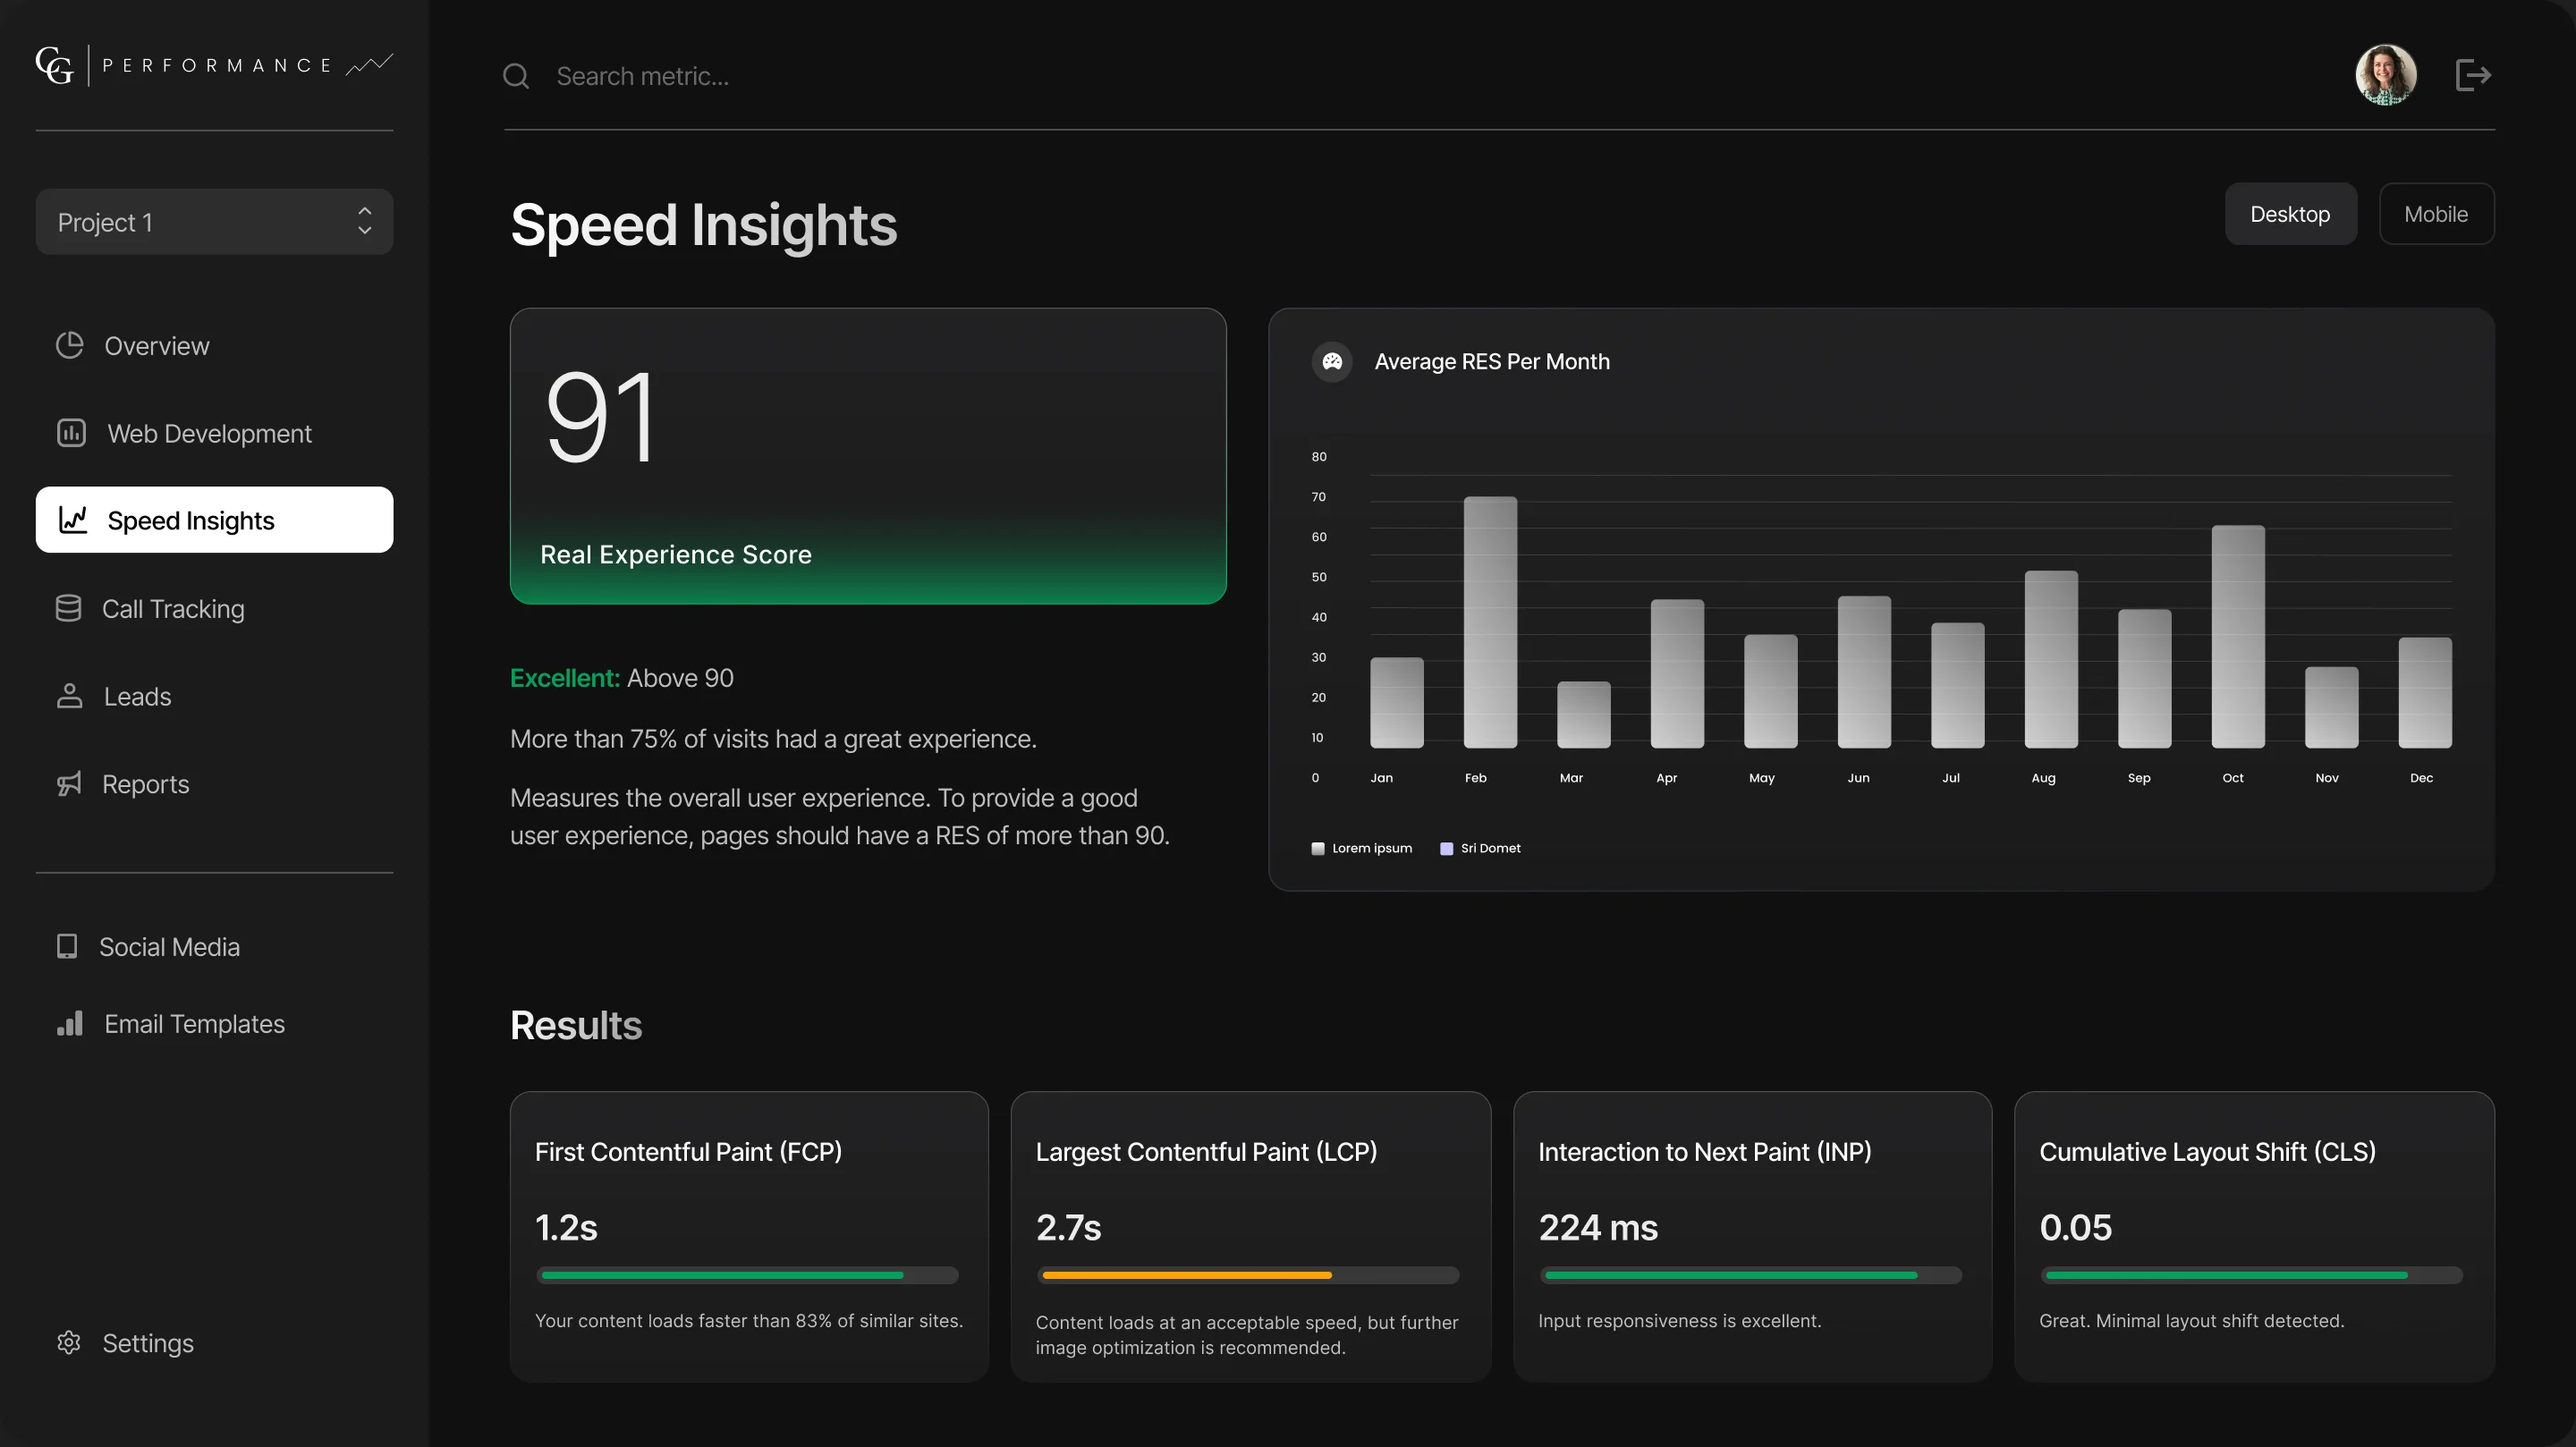
Speed Insights
The Real Experience Score sits front and center with a plain-language verdict (“Excellent: above 90”), a monthly trend, and the four Core Web Vitals, each with a progress bar and a one-line explanation.
Leads
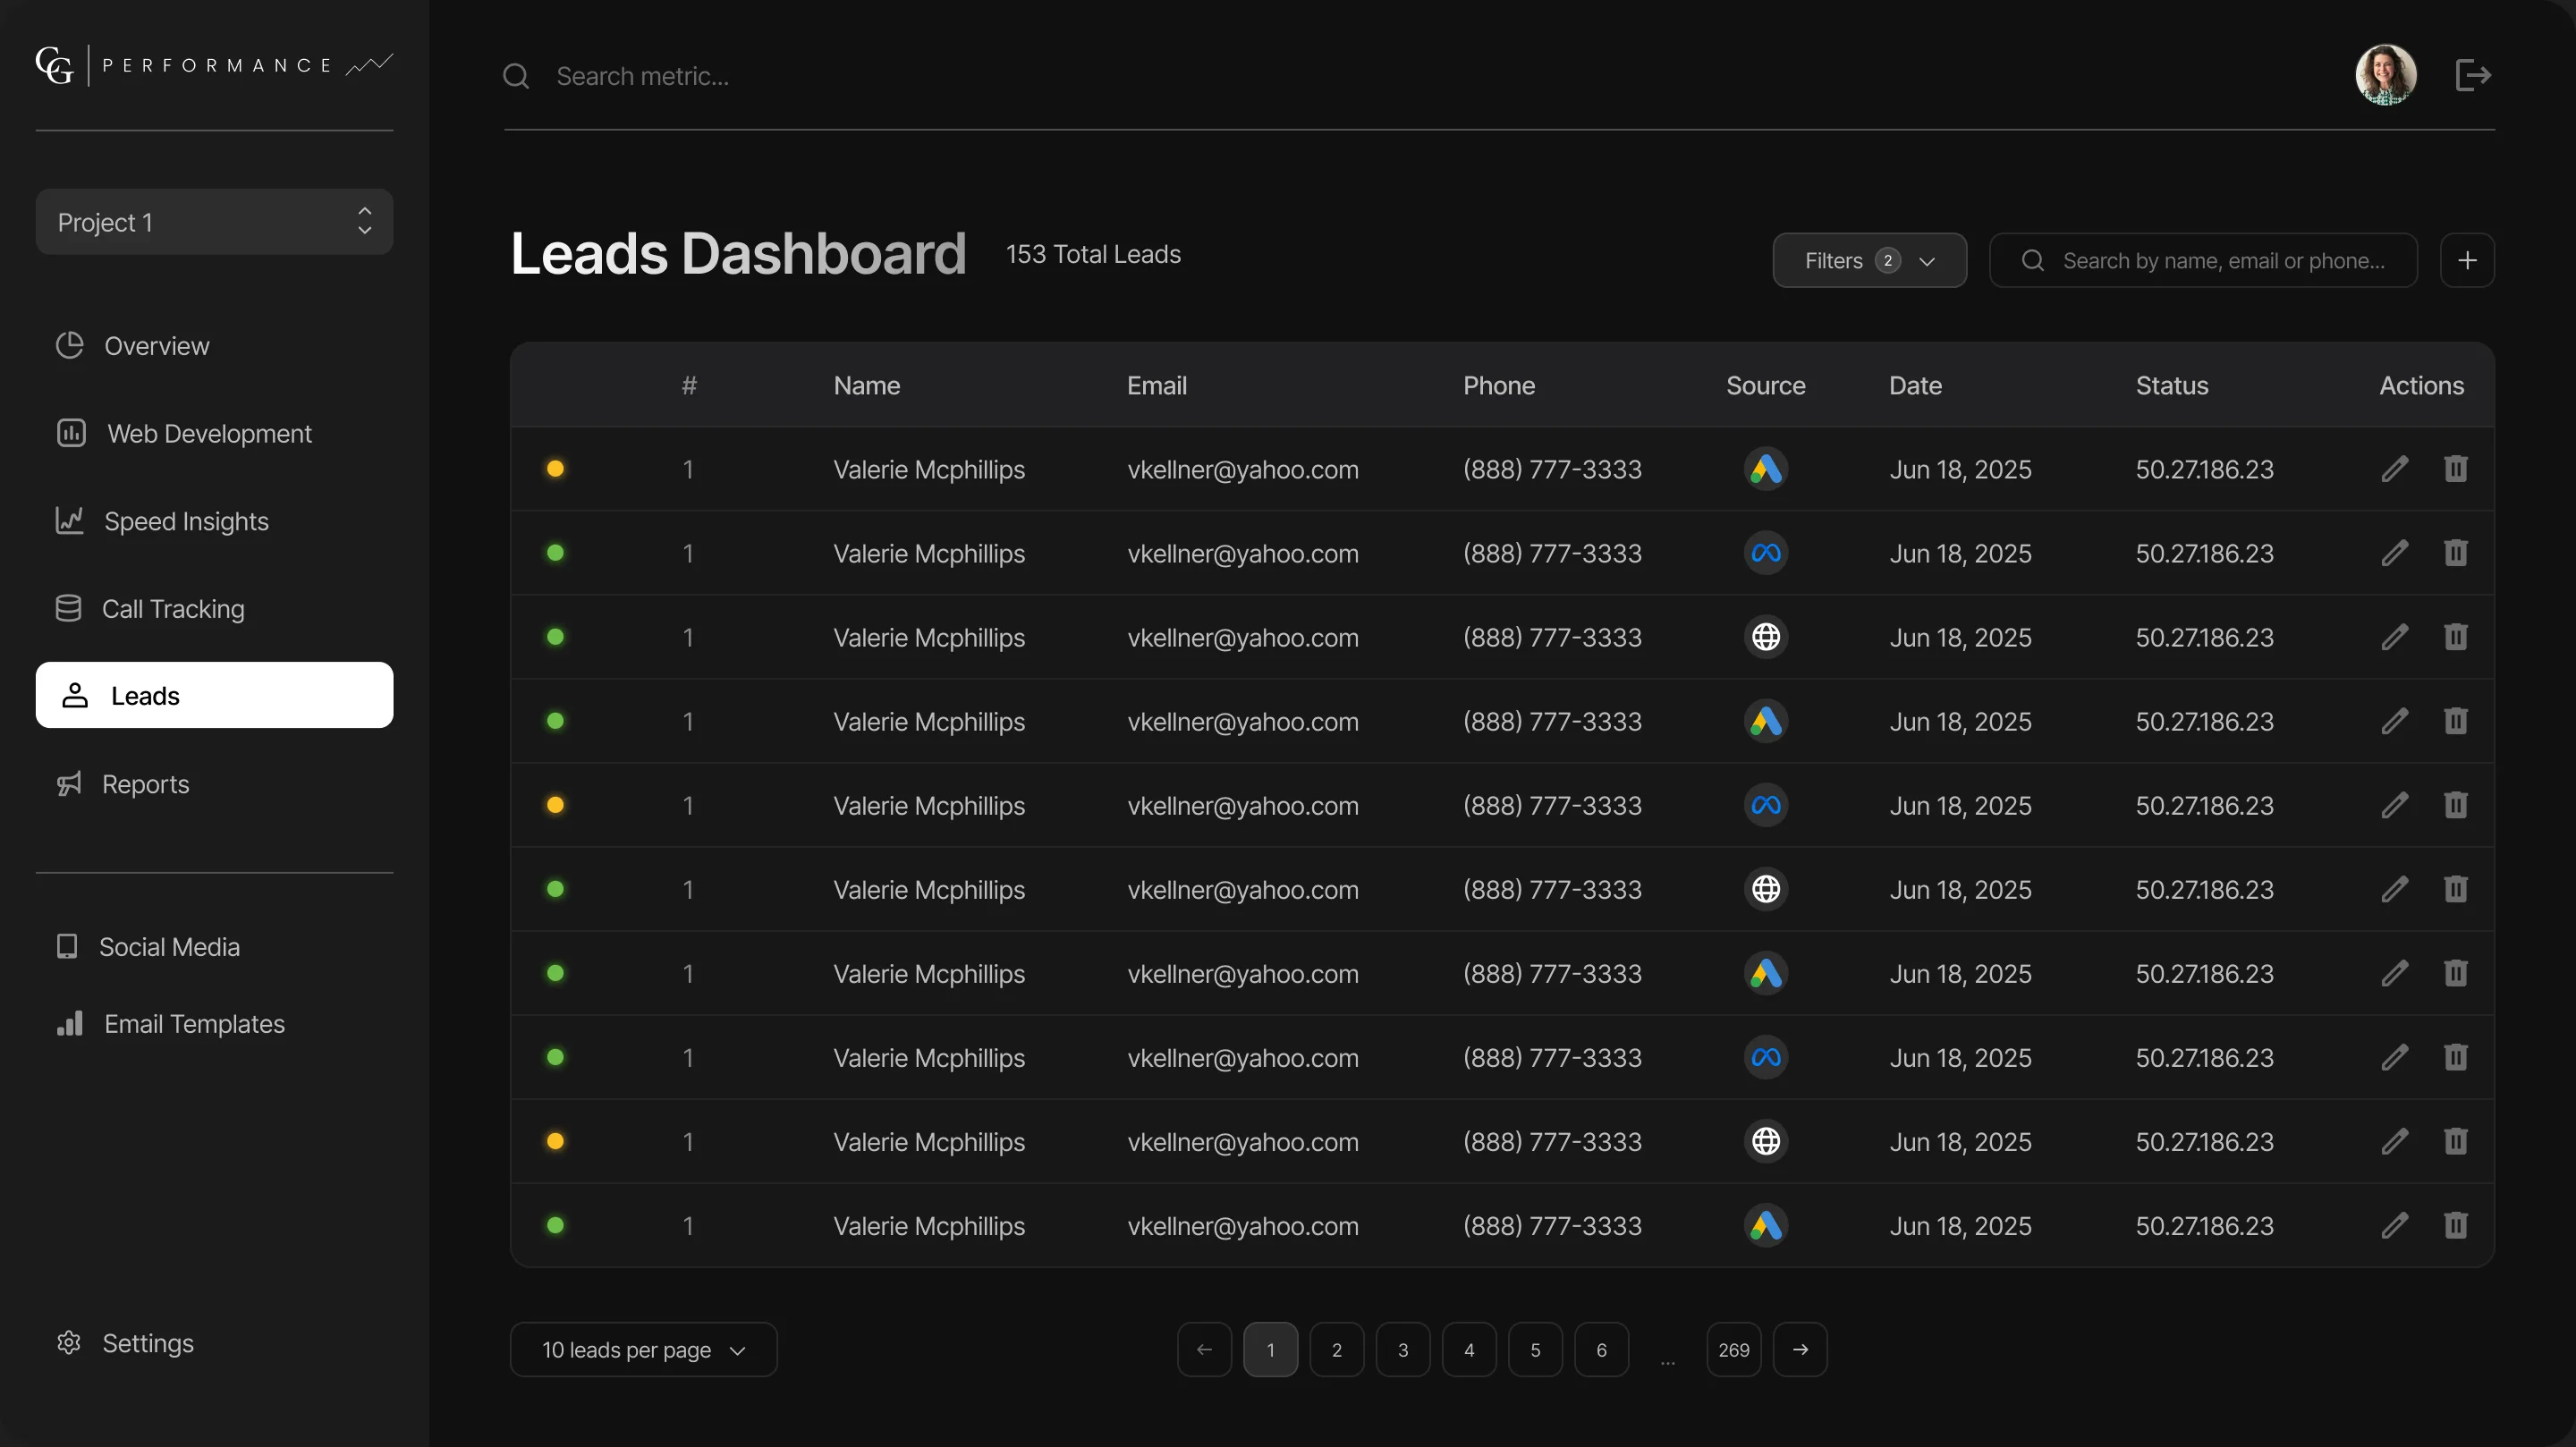
A dense but scannable table: a status dot, contact details, source icons (Google Ads, Meta, organic), date and quick actions, with filters, search and pagination for firms with thousands of leads.
Email Templates
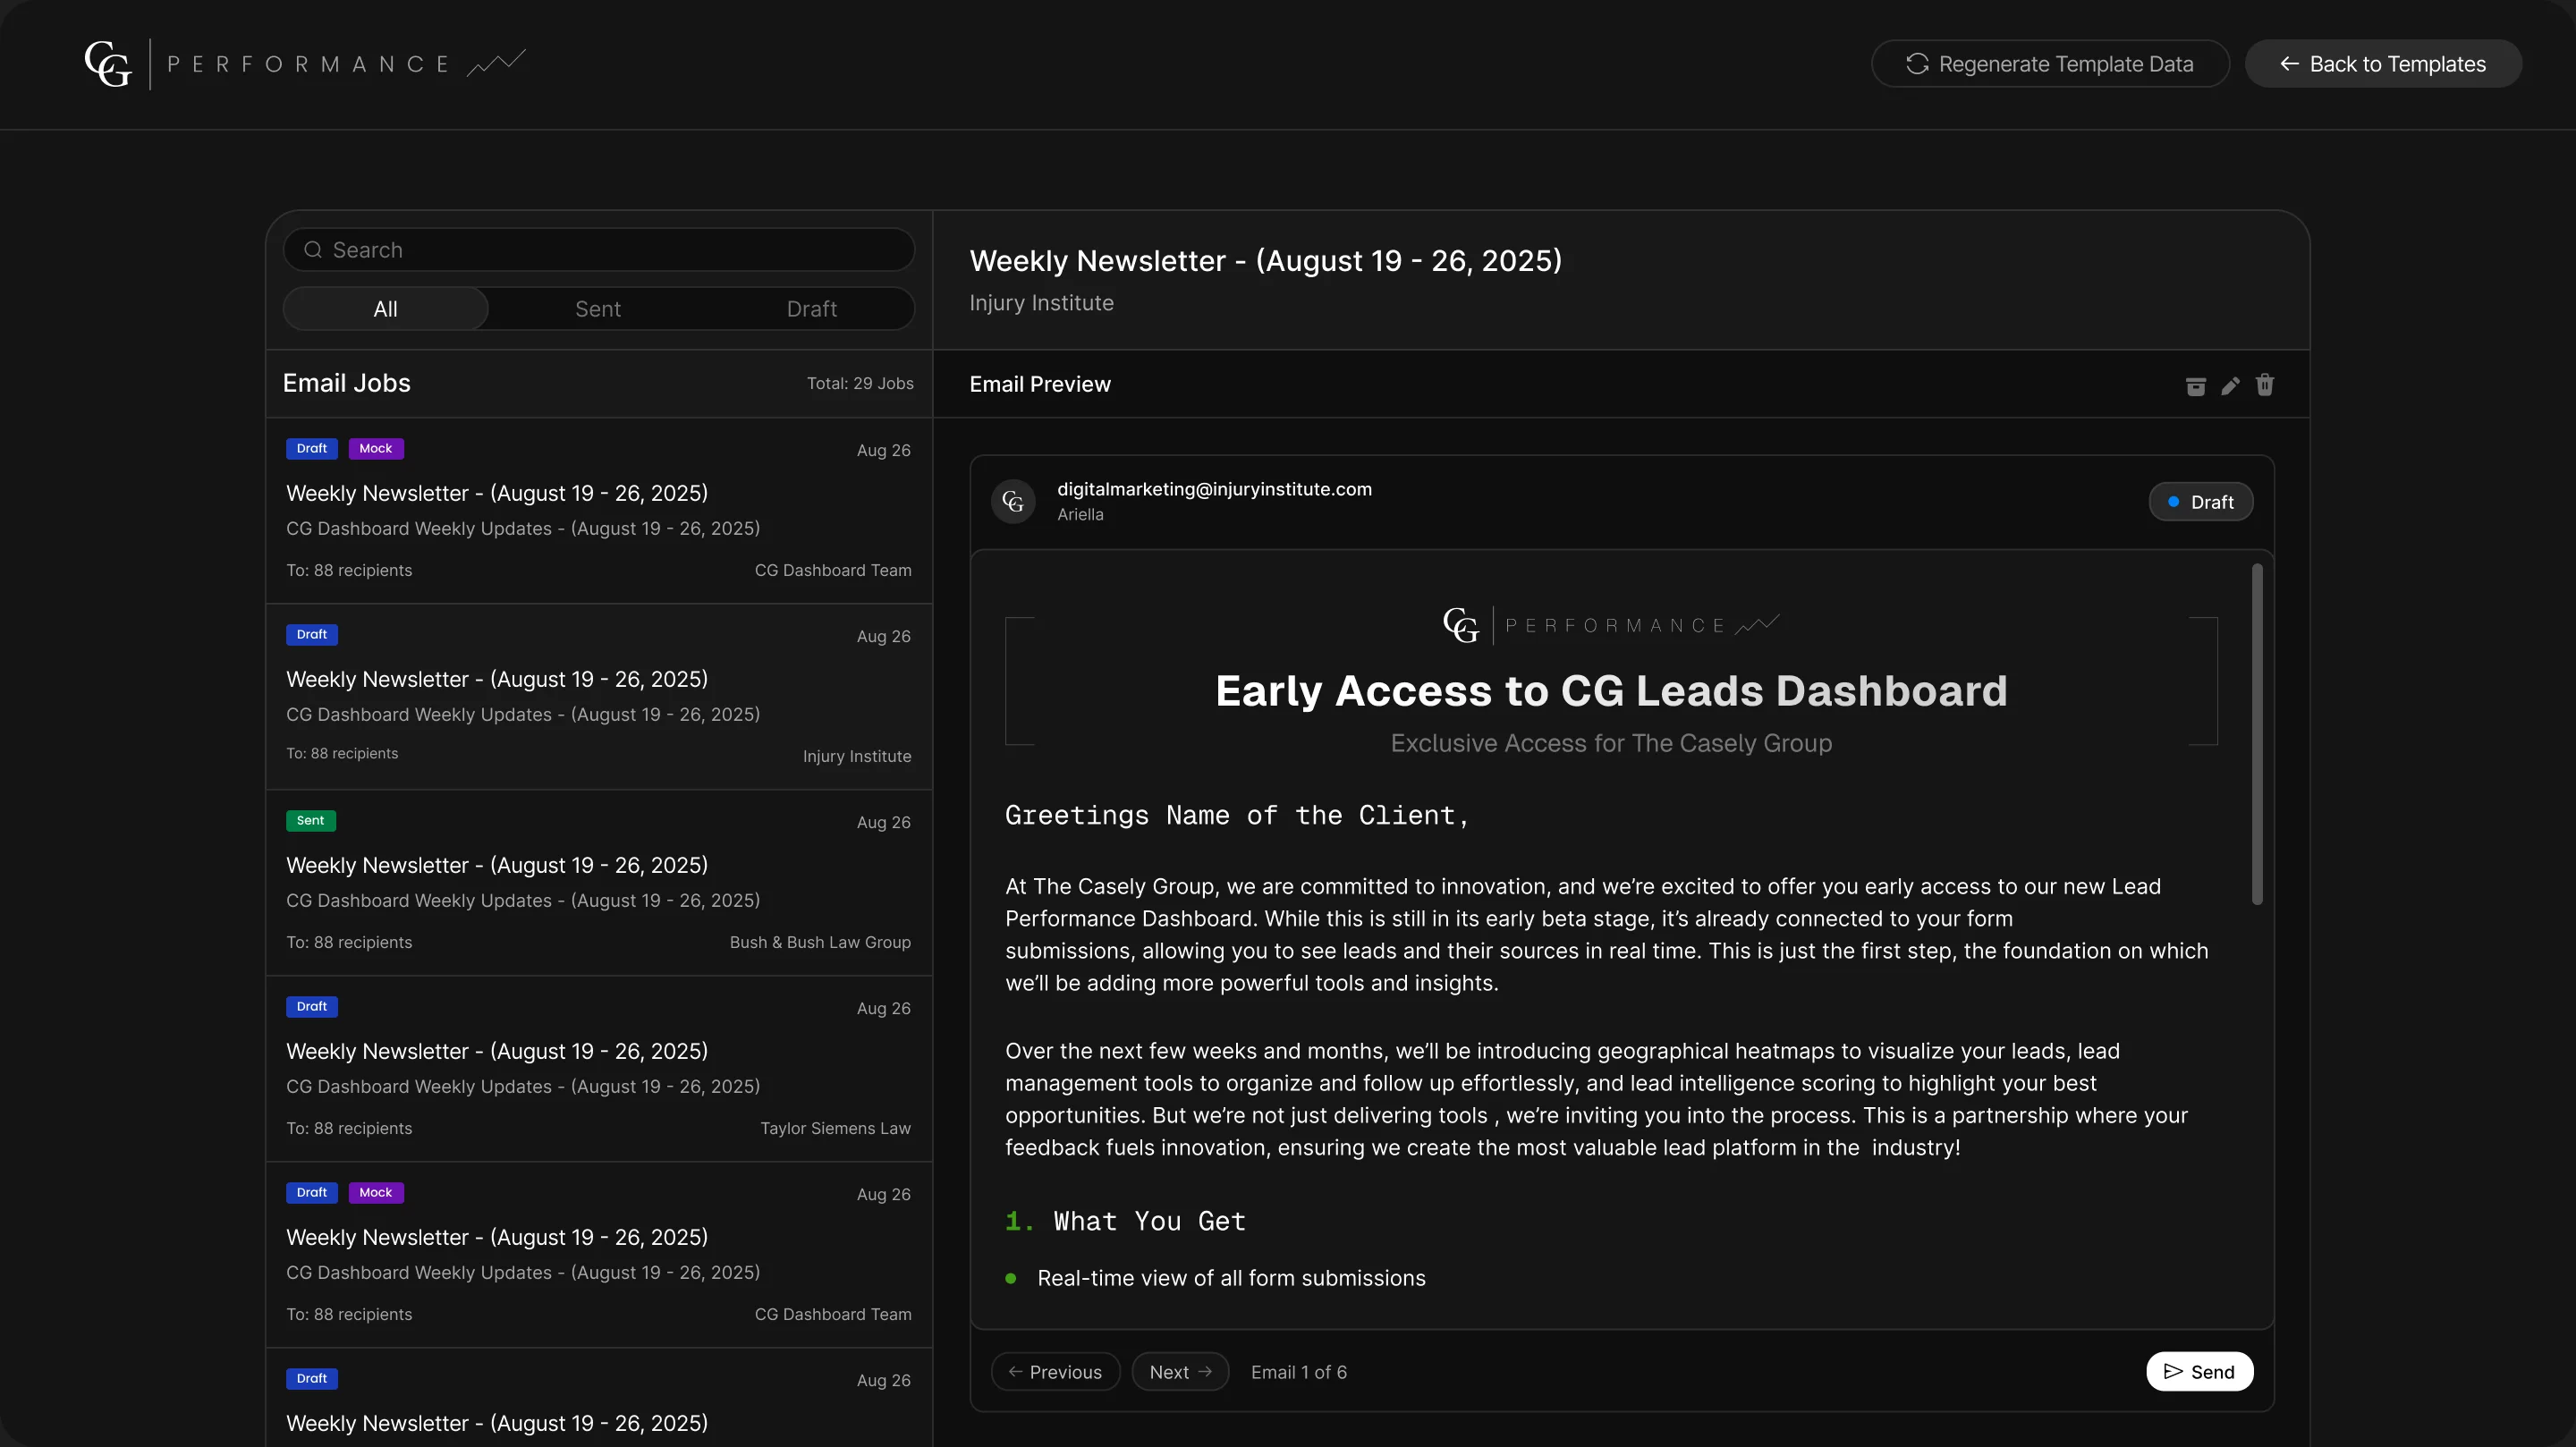
An internal tool for the team: browse email jobs by status, preview each personalized email, then edit its merge fields, including the AI-generated introduction, before sending.
 Back to all projects